Application insights causing high CPU 100% on Azure Web App
So recently we noticed that we were having spikes in the CPU on our Azure Web App plan and spent some time looking into it to try and find the root cause. We have 4 Web Apps running with our App Plan and narrowed down which one was causing the spikes (it was our main application). The CPU spikes were often hitting 100% and they were enough to cause our autoscale to kick in and scale out our App Plan to another instance to cope with the load.
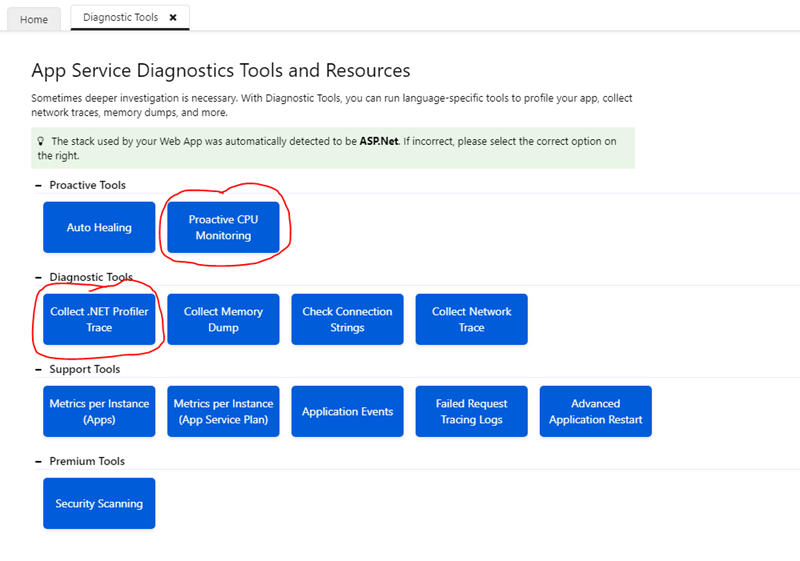
The strange thing was that these spikes were sometimes occurring at times when the load of the application should be quite low (i.e. out of regular working hours). We raised a ticket with Azure support and managed to help identify the Web App causing the spikes (which we already knew) and gave us some suggestions for how to try and debug the issue. Their suggestions included running "Proactive CPU Monitoring" and "Collect .NET Profiler Trace" from the Diagnostic Tools in our web application.
We looked through the dump and logs files these tools produced but couldn't find any concrete evidence as to what in our application could be causing the spikes. So we decided to turn to Application Insights, were we getting hit by bots? Were we under some sort of attack? Who knows, but we through Application Insights to the rescue which should show us what is going on at the time of the CPU spikes.
So we started going through the Application Insights data looking at around the time of the high CPU to see if we could see something in our code that could be triggering it. We found that around the time of each CPU spike there was the following "Trace" showing in Application Insights.

This event seems to be related to Application Insights Profiler functionality which collects profiling traces to help you see where time is spent in code. Could it be that Application Insights, the tool we were using to try and debug our high CPU problem was actually the cause of it or was this just a coincidence?
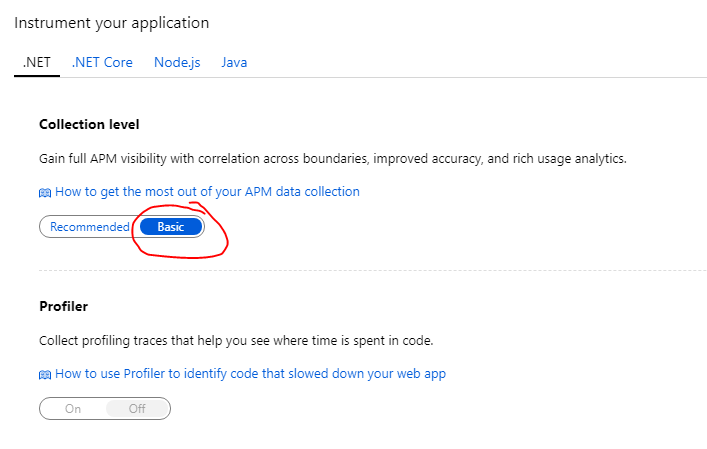
Well, we decided to try changing the Application Insights Collection Level from the "Recommended" setting to the "Basic" setting which turns off some of the functionality including the "Profiler" feature.

We monitored the CPU of our Azure Web App over the next few days and here are the results.
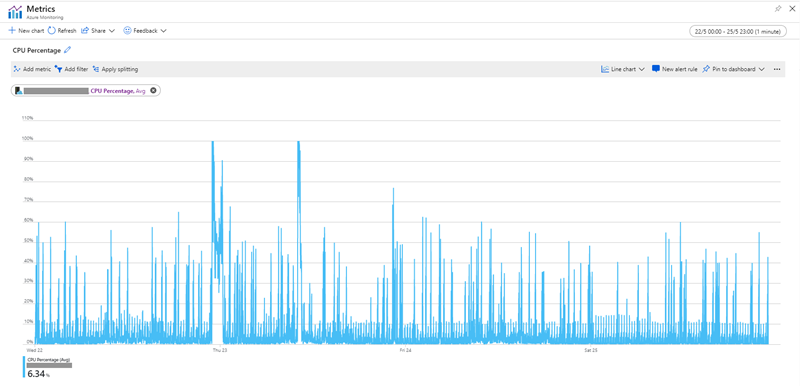
The screenshot below shows the average CPU of our Web App Plan from Wedneday to Saturday the week before we made the changes to the Application Insights Collection Level. As you can see there are two hugh spikes in CPU where it is running at 100% Wednesday evening and another one during the day on Thursday, also there are various spikes during any given day where the CPU hits around 60%.
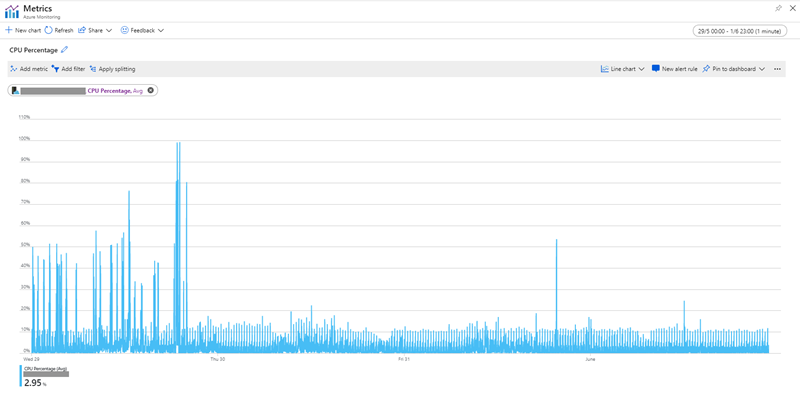
The next screenshot below shows the CPU average of our Web App from Wednesday to Saturday the following week, we made the change to the Application Insights settings Wednesday evening (you can see the obvious reduction in CPU from this point onwards).
It seems quite clear that changing the Application Insights settings have made a huge difference on our CPU. The features of Application Insights are great and no doubt very useful for most people but it seems if you are trying to keep the cost low for your Azure App Plan and don't need all the features turned on all the time then I would definitely consider changing the Collection Level to Basic.


